Node-RED Data View Node
January 26, 2021 - Written by Mike Blackstock
This summer I started checking out some of the more interesting projects happening in the Node-RED community. If you aren’t familiar with Node-RED it’s an open source ‘low-code’ visual programming tool that allows users to wire together various components that communicate with devices, services and APIs. It’s built with Javascript and Node.js making it easy to extend by adding your own nodes. I am a HUGE fan.
To get going I thought I’d create a new node. Inspired by a cool demo, I ended up publishing the data view node that displays charts within a Node-RED flow.
Inspiration - the image output node
In my travels, I came across a great demo on YouTube where Node-RED is used for a machine learning application using TensorFlow. I recommend that you check out this video and the associated tutorial if you are interested in using Node-RED for machine learning.
In this demo the authors use several nodes including one based on the node-red-contrib-image-output node. This node is useful for debugging ML applications like face detection, object recognition and others that involve images as shown.
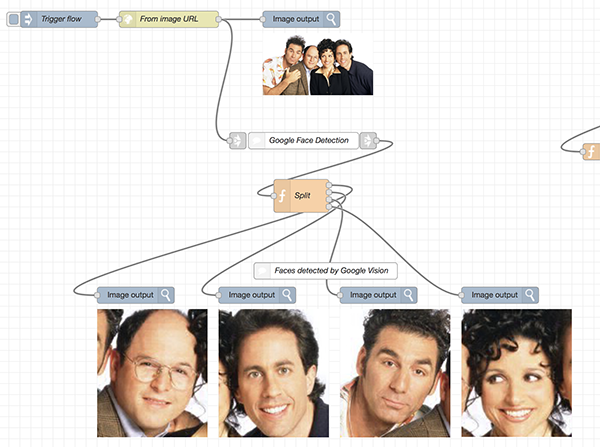
Example flow using the image output node displays recognized faces right in the Node-RED flow.
This was the first time I’d seen live data displayed directly in a Node-RED flow. It made me think that it would be cool to display other forms of live data within a flow, rather than in another page like a dashboard or in the Debug side bar.
The data view node
As an initial step, I thought it may be worth trying to leverage the d3 library that is used by the Node-RED flow editor to display charts within the flow. So I started working on the node-red-contrib-data-view node.
The image output node provided a good pattern for how this node would work. It demonstrates how to draw a resizable box around a display area under a node and relay the data received from the node to the Node-RED front end. I decided to maintain a configurable buffer of data points for each of the nodes in the front end, and a simple way of clearing the graph by sending in null data. Once I had that working, I used d3 to create a line chart, and make sure the line chart scaled the x (time) and y axis correctly in the node display area. Ensuring the chart always fit in the box, regardless of the size of the data values was an interesting challenge. Check out the code for more details.
An example flow using the data view node is shown below.

Example flow showing the data-view node displaying data over time.
After the initial release of this node, it prompted a discussion on the Node-RED forum where several issues were raised:
The editor is not a dashboard
This node uses the Node-RED flow editor not only as an editor, but also as a dashboard. It is not clear that this is a direction that the community wants to go. The side bar may be a better place to display data in more interesting ways. Perhaps a future version of this node could use the side bar for graphs?
Do we need another charting node?
Other users didn’t see the need for another charting node since the dashboard nodes provide this. Others thought they would find this node (and others like it) valuable as part of an extended debugging facility similar to that provided in other data flow tools.
It’s a hack
Like the image output node, this node assumes a certain implementation of the Node-RED front end, effectively hacking the node-drawing layer. This implementation will likely change over time. It will be important for this node and others like to carefully track changes to the Node-RED flow editor.
Won’t this node crash my browser?
Related to this, another concern was that this node could crash your browser, something that you would not want to happen during flow development, or ever. Since any misbehaving node can potentially cause problems with the Node-RED editor or runtime I’m not sure this issue is specific to this node.
Takeaways
Overall the feedback for the data view node has been positive. I received a number of bug reports and suggestions for enhancements so far. I still have a number of ideas on the to do list including supporting multiple lines and storing data in the backend so that it persists between browser refreshes. I need to ensure the code that creates the display box is carefully separated from the rest to ensure that minimal changes are needed when the Node-RED flow editor is updated.
I think that this node and the image output node are both useful for quick demonstrations, debugging and exploration by making it possible to view live data as it moves through the flow. By pushing the envelope of what a node can do, these nodes can help identify new requirements for Node-RED such as new APIs and plug in capabilities. The downside is that today, they need to be carefully maintained as the underlying implementation changes. In the future, I hope that we (i.e. the Node-RED community) can design and implement a general purpose UI and associated API for displaying live data in the flow canvas to support this capability in more nodes.
I’d like to thank Nick O’Leary @knolleary and Dave CJ @ceejay for creating Node-RED and their support and feedback. Let me know what you think of this node. Leave a comment here or open an issue on github.